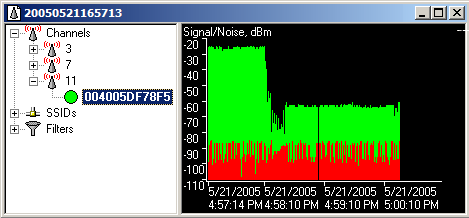
Let's revisit the power loss we observed when we moved a portable computer away from the access point it was communicating with.

The horizontal axis in this graph shows time. We recorded signal power during a little over three minutes, but what of the vertical axis?
The vertical axis measures signal power, but it is not shown directly in watts. The vertical axis shows relative power, dBm, which stands for decibels relative to a milliwatt. A milliwatt is one thousandth of a watt, and the graph shows power levels compared to a milliwatt.
When my computer was in the same room as the base station, the signal was fairly steady at around -24 dBm and when I settled down in the living room it was down to around -60 dBm. While I was walking and repositioning the computer, it dropped to around -75 dBm.
Decibels are a measure of the ratio of two power levels. As a rule of thumb, power is doubled with each three decibel gain and halved with each three decibel loss.
For example, when the computer was near the access point, the signal power was -24 dBm or 24 decibels below one milliwatt. A 24 dBm loss represents eight halvings (24/3=8), so the received signal was about 1/256th of a milliwatt.