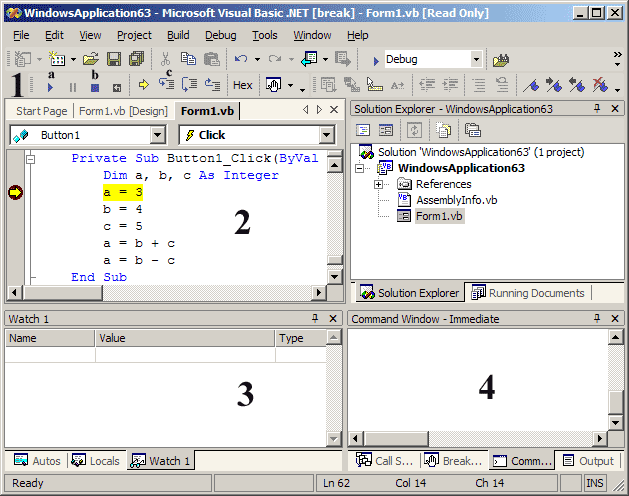
- Breakpoint control buttons. We will focus on three of these which allow us to continue execution normally (a), stop debugging (b), and execute a single instruction at a time (c) while observing the values of variables as they change.
- Code window, highlighting the instruction we have paused at.
- Watch window, in which we can observe the changing values of selected variables.
- Immediate window, in which we can both observe and change variable values while execution is paused.
Note that the bottom two panels have several tabs, and we have selected the Watch 1 and Command Window - Immediate windows. You will find these most useful for debugging the relatively small programs we are writing while learning basic programming concepts.
If the Watch and Command windows are not visible, use the Debug menu (while debugging) to display them:
debug > windows > immediate
debug > windows > watch > watch1
